Fairly evaluating the impact of different Android UI libraries on Gradle build
For an Android application maintained by a large group of developers, build time is one of the most critical developer ergonomic metrics. This is particularly true when we evaluate to adopt new technology. Jetpack Compose is the new exciting modern UI library to build Android applications. Its official documentation already covers developer ergonomics on two of their sample applications. Although the comparison narrated in Jetpack Compose: Before and after were valuable, we would like to apply scientific control to our experiments, in order to fairly evaluate Compose against the existing UI layer technologies, such as Data Binding and View Binding.
Fairness
In a scientific experiment study, we use variables to test our hypothesis. There are basically three groups of variables:
- Independent variable as the input of our evaluation. Since we are evaluating the different Android UI libraries in this study, the particular type of UI library becomes our independent variable. Namely, Jetpack Compose, Data Binding, View Binding, and plain View.
- Dependent variable as the output of our evaluation. We would like to see how the choice of UI library impacts Gradle build, so the dependent variable could be any metric from our Gradle build. For instance, clean build time, incremental build time, and the timeline of the task execution.
- Control variable as the constants in our evaluation. We want to ensure the comparison to be performed with the same context. This means we need to ensure the same machine spec, same Gradle version, same Android Gradle Plugin version, same module dependencies, and same UI appearance. However, for large-scale applications, we are very unlikely to complete the full UI layer migration with a single atomic commit. Oftentimes, we are doing migrations over multiple commits spread over a time span, mixed with other commits to upgrading dependencies and altering module structures. With multiple commits, we become less confident in holding our control variables as constants!
Setup
While it is nearly impossible to perform an absolutely fair evaluation in production apps, Android Studio poet is a great tool to generate synthetic Android projects. We can customize the configuration to specify the details of tooling versions, module structures, and code complexity. This flexibility can be used to guarantee the fairness of our evaluation at best. If necessary, we could even configure the generated Android projects to closely match our production apps.
In this study, we are using the configs in the Android Studio poet repository. A high-level summary for the control variables:
- Gradle version: 7.2
- Android Gradle plugin version: 7.0.2
- Kotlin version: 1.5.31, as required by Compose 1.0.4
- Java runtime version: 11.0.10
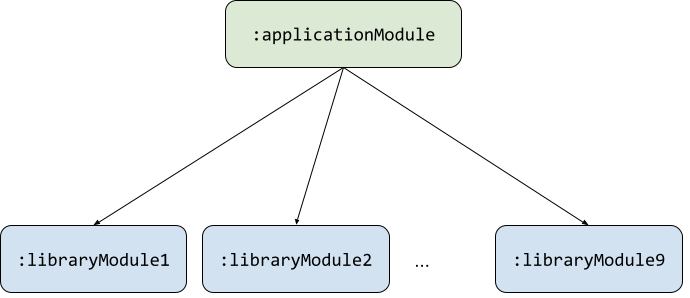
- Modules: 1 Android application module and 9 Android library modules (See module dependency below).
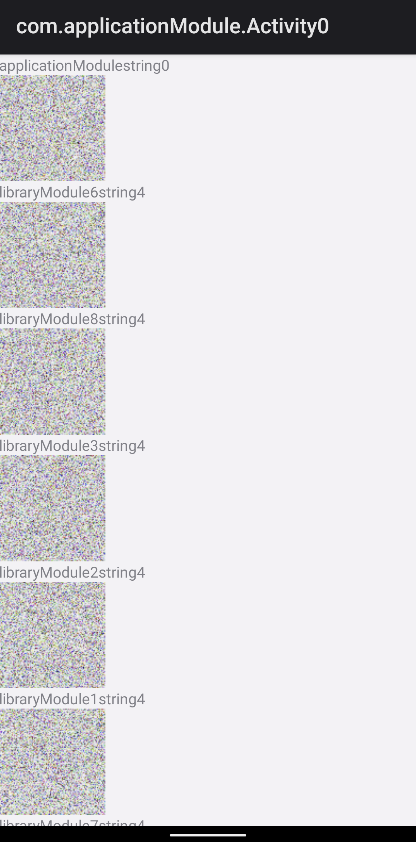
- Complexity: Each module has 40 non-Android Kotlin classes, 5 Activity classes, 5 UI layouts, 5 images, and 5 text string resources (See screenshot below)
- Device spec: MacBook Pro 16-inch 2019, 2.4GHz 8-Core i9, 32GB Memory
- Gradle configuration: JVM heap size = 4G
- Task measured:
assembleDebugas our main development workflow


Gradle profiler is another handy tool to be used for benchmarking our builds. It has a feature to perform warmup builds before measured builds, to counterbalance the impact of the Gradle daemons on our build execution time (Because Gradle daemon keeps project structures in a long-lived process). We are going to use Gradle profiler to measure the build metrics as dependent variables of those generated projects with different Android UI libraries, as the value of the independent variable:
- Compose
- Plain XML-based View
- View Binding
- Data Binding (without kapt)
- Data Binding (with kapt)
Result and analysis
Tasks for assembleDebug
Let’s look at the total number of tasks first.
- Compose: 410 tasks
- Plain: 410 tasks
- View Binding: 440 tasks
- Data Binding (without kapt): 450 tasks
- Data Binding (with kapt): 470 tasks
The total number of tasks in a Compose build equals that in a plain build. This is expected because most of the UI processing logic is implemented as a Kotlin Compiler Plugin, and no additional build tasks are necessary beyond compiling the Kotlin code.
A view binding build has 30 more tasks than a plain build, namely DataBindingMergeDependencyArtifactsTask, DataBindingMergeBaseClassLogTask, and DataBindingGenBaseClassesTask. Even more, a data binding build has 10 more than a View binding build. This is within our expectation because view binding does not need annotation processing and should have a simpler build along with a faster compilation time.
A data binding with kapt build has 20 more tasks than a data binding build (KaptWithoutKotlincTask, KaptGenerateStubsTask). Kapt needs to generate stubs from Kotlin source code to be recognized by Java annotation processors. These additional build steps explain the increase in the task number.
Clean build time
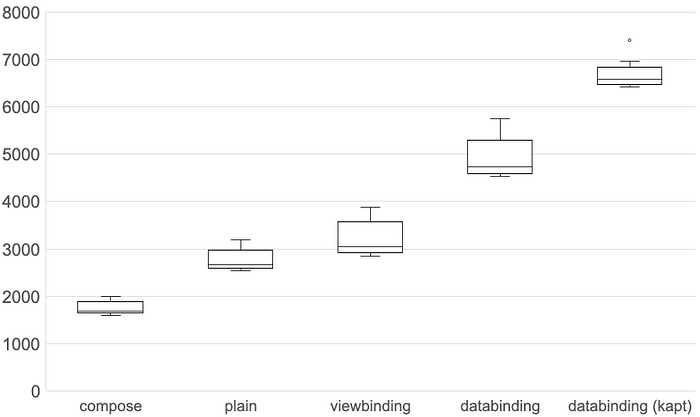
The default benchmark option from Gradle Profiler is used to run 6 warm-up builds and 10 measured builds. The following illustration is a box-plot view of the clean build execution time by the UI library types (Because we prefer not to assume the distribution of the build speed). A box plot describes the min, 1st quartile, median, 3rd quartile, and max for a group of values.

If we want to know whether there is a statistically significant difference between to compose build and the data binding build, we could use the Mann-Whitney U test to test our hypothesis. For simplicity, let’s not pursue that route but focus on the obvious here.
The plain build is indeed the fastest, as it is an ordinary and least fancy build.
The view binding build comes second: When we examine the build scan, the DataBindingGenBaseClassesTask takes <0.1 seconds per module, and so do other data binding related tasks.
The compose build comes third: According to the build scan, the execution time for each compileDebugKotlin increases by 1 second over the one in plain build. This reflects the fact that the code manipulation by compose compiler is still a non-trivial process.
Then comes the data binding build, whose compileDebugJavaWithJavac execution time increases by 2 seconds. This indicates that the generated Java code in data binding build is more complicated than view data binding build.
The slowest build is the data binding with kapt, because kapt needs to generate stubs and perform a more complex annotation processing.
Incremental build time
Another useful dependent variable in our fair evaluation is the incremental build time. Gradle by default provides up-to-date checks for incremental builds, and we may have Gradle local or even remote build cache enabled. In either case, when recompiling the project after making incremental changes in UI, we often can skip some tasks or reuse the task outcome in previous runs. Therefore, incremental build time is also a meaningful metric to monitor in common development workflows.
To set up, for non-compose builds, we use the apply-android-layout-change-to mutator from Gradle Profiler to add a dummy view to a layout file in a library module. Equivalently for the compose build, we will use the apply-composable-change-to to add a @Composable function to our own Activity class the library module.
We will still use 6 warm-up builds and 10 measured builds for incremental build time. The uniqueness becomes that we do not run clean between each measured build and build cache is enabled. The box plot for the incremental build time is illustrated below.

The relative ordering of plain, view binding, data binding, and data binding kapt build remain unchanged, which is consistent with their complexity observed in the clean build time benchmarking.
Let’s zoom in on the task execution timeline for the compose build, plain build, and view binding build for further investigation. Although we applied the change to the UI in the library module, the hot spot, as a matter of fact, is the application module.
Processing resources

It is quite easy to discern a significant speedup if we compare the execution time for these two tasks: mergeDebugResourcesand processDebugResource. In Compose, altering layout does not require processing resources and only requires recompiling Kotlin source code, therefore the task can be skipped (Up-to-date). On the other hand, resource processing could take a significant portion of time: The plain build and view binding build are both spending 1 second in total in the application module, when the library module resource is changed.
Resource processing in an Android project build has historically always been a savage beast. The Android Gradle Plugin has been constantly evolving to optimize resource processing and there are quite a number of compilation flags we can experiment with. If you are interested, I would recommend this blog post The past and future of Android R class for this topic.
Incremental compilation

Another discovery goes that kotlin compilation task is faster in the compose build. From the task detail, we can find the following message displayed for plain build and view binding build, but not the compose build.
Input property ‘classpath’ file applicationModule/build/intermediates/compile_and_runtime_not_namespaced_r_class_jar/debug/R.jar has changed.This makes sense in that compose build does not require processing resources, therefore the R class is not changed. For the plain build and the view binding build, R class is changed and the Kotlin files consuming R also need to be recompiled.
There is a less known but important feature offered by Gradle: incremental compilation. This solution improves build performance by recompiles files that are actually affected by a change. In our case, R class is not changed for the compose build, and fewer files are affected. This leads to the task execution time :applicationModule:compileDebugKotlin for the compose build to be much smaller.
If you are interested, check out this official blog post from Kotlin: The dark secrets of fast compilation for Kotlin about incremental compilation in Kotlin.
Summary
Through a synthetic project setup, we fairly evaluated Compose against the other UI libraries on their impact on Gradle build. Our impression is that:
- Android XML-based View (plain build) is the fastest in terms of clean build time.
- Compose build is comparable to plain build in clean build time, and is the fastest in incremental build time under the scenario of UI layout changes.
- If the project is heavily relying on Data Binding, migration to Compose build will almost certainly reduce the build time.
This story, along with our impression, is intended to be inspirational and not conclusive:
- The project dependency structure varies a lot by the size of the applications and the team structure of the developers working on the applications (Do you know about Conway’s law?). For big teams who are curious about the Gradle build impact of Jetpack Compose, I would recommend repeating this evaluation using a project setup closer to the actual application.
- The build tools are evolving with the newer versions of Gradle, Compose compiler, Android Gradle Plugin, etc. With newer optimizations, the impression might no longer be accurate in the future.
Last but not least, I would like to thank my colleague Curtis Kroetsch to review this article!
Further reads
Here is the list of Github repos and articles to check out:
- https://github.com/android/android-studio-poet
- https://github.com/gradle/gradle-profiler
- Jetpack Compose: Before and after
- The past and the future of Android R class
- The Dark Secrets of Fast Compilation for Kotlin
If you feel this story is useful to you, you can choose to support me by joining Medium membership.
